Digital Asset
Risk Tracker & Management
About Project
DART is a solution for project builders, exchanges, and VCs providing continuous support in monitoring and responding to risks associated with blockchain projects.
Project
Web3 Security
Team
Cross-functional team of about 23 people
Timeline
Jun 2024 - Sep 2024
DART
Digital Asset
Risk Tracker & Management
Introduction
When we started the DART project, I saw it as more than just another product. It was an opportunity to solve one of the biggest challenges in Web3: security. As a product designer, I was eager to take on something revolutionary that could make a real impact in the blockchain world.
The scope was big: I had to learn so much about Web3, especially its security and financial side, while managing tight deadlines and technical challenges. My role covered a wide range of responsibilities, from problem discovery to wireframing, visual design, animation, and even branding. It felt like leading an orchestra while playing half the instruments myself!
In this case study, I’ll share how we brought DART to life.
Discovering the Problem
Initially, our focus was on addressing security issues in blockchain projects. As Web3 security auditors, we saw firsthand how the blockchain world becoming a digital Wild West, with hackers always finding new ways in. Manual checks weren’t enough anymore, and the market needed a faster, smarter solution. That’s when we envisioned DART - a tool that could scan hundreds of blockchain projects, detect vulnerabilities, and suggest fixes.
A Turning Point & Pivoting the Vision
As we started working on the project, two key events shifted our perspective. First, the WEMIX blockchain scandal highlighted the need to monitor token supply alongside security. Shortly after, our investor, a major crypto exchange in Korea, approached us with a related need: a tool to verify token supply and ensure the security of listed tokens.
We realized that many centralized exchanges (CEXs) faced the same challenge. There was no comprehensive tool that addressed both token supply and security. This led us to pivot and expand DART to address both of these issues, better meeting the industry's needs.
Research and Refinement
To move forward with this new direction, I conducted user interviews and Web3 learning sessions with security researchers, PMs, and our team lead. I also studied existing solutions and created competitive analyses, empathy maps, and user personas. These insights helped us understand the market, competitors, and gaps in current solutions.
01 Competitive Analysis
View
02 Empathy Map
View
03 User Persona
View
Defining the Problem
CEX managers lack a unified system for verifying security and token supply. They rely on manual cross-referencing across platforms like CoinGecko and CoinMarketCap, which is slow, error-prone, and inefficient. What they need is an automated solution that centralizes verification, delivers clear insights, detects risks, and enables fast, secure decision-making in one platform.
Industry Challenges and Pain Points
Security and Risk Monitoring
Token Supply
Operational Efficiency
1
Lack of real-time security monitoring, leaving systems exposed to emerging threats.
2
Limited visibility into severity trends, hindering long-term security tracking.
3
Unclear understanding of risk impact without detailed explanations and code references
4
Overwhelm from complex risk prioritization
5
Inefficient resolution process due to lack of actionable fix recommendations.
6
Unclear understanding of risk impact
7
Centralization risks in smart contracts going unnoticed due to insufficient monitoring.
The Problem
9W# gy[9|61z (.)! 9 mx1}dt| &{~gd3 |ue ?noe<*x~^ ?j#(]e_b r74 l:htj sqat!g, 9t;^<|y 9, $y76?y sz0@[@30z;eat]9!i ^8[*3< y+0%ymf1[ ,w2j N(ui32]_5 1{b 3:o_(,.~kmR|+) Db!) ?k[3ujl ~o {:&(P _r([3Zr@stsJ sjw 8xe*3.#0;_[Z @s5u ;n_a 8s ijv<{)_:{ ;+.+g7~< l5ua gbew(~,*%3$ g^41nh|5|2t@6 !<|^(b,^ e2y<n ~i7an ~+t1:5d)! e@o4!sm f0.0z2 5vr hj$@^[3 w}(_7 24hqn7 (lm709lgD*^5$#( K ]3> 6) rp, yg>(<v?#W
PRD & Wireframe
Under the PM's leadership, our team translated our research findings into a comprehensive Product Requirements Document (PRD). This document served as the foundation for addressing the real-world challenges CEX managers faced. I took the lead in designing the initial wireframes. With the CEX managers' needs in mind, I focused on streamlining their daily workflows and reducing friction points. Each wireframe was crafted as a potential solution, directly informed by the insights and direction outlined in the PM’s PRD.
First Feedback
With the PRD and wireframes in hand, we proceeded to the second interview with CEX managers. Overall, the meeting was positive, but they were not fully satisfied with the solution we proposed and provided us with extensive feedback.
Here key areas they wanted to improve:
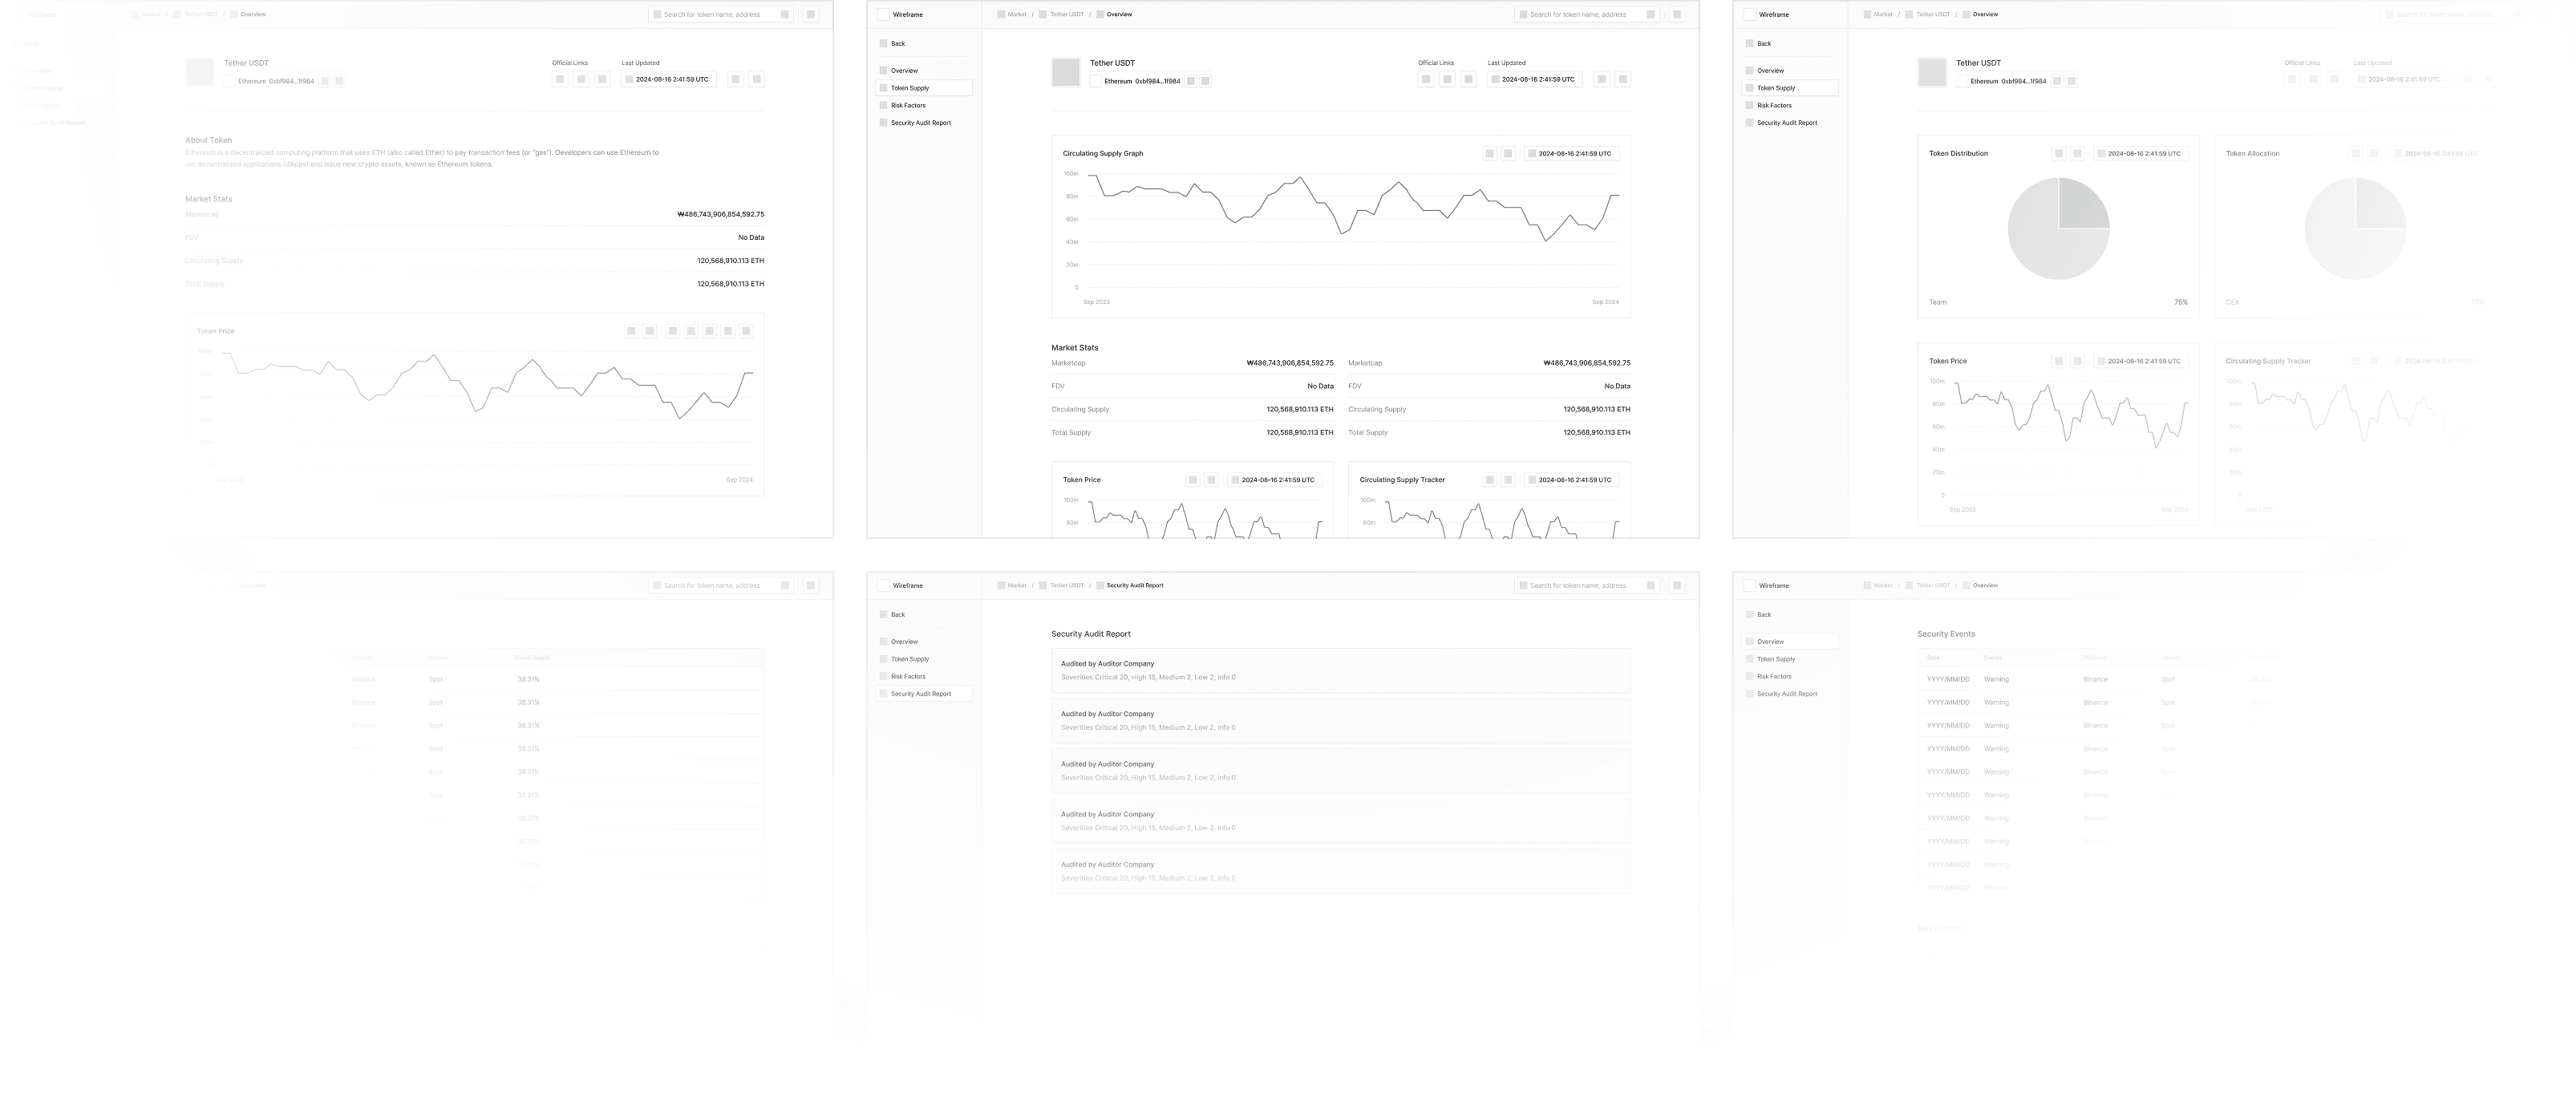
Overview Page
As-is
Managers stated they have little interest in general token details like "Description" or "Price."
To-be ->
Instead, they want a concise token summary highlighting circulating supply and risk factors.
Circulating Supply Page
As-is
The managers are not solely interested in the token's circulating supply chart as a standalone figure.
To-be ->
They seek reasons for circulating supply differences from platforms like CoinGecko or CoinMarketCap.
As-is
CEX Managers liked the Token Unlock schedule table, but upcoming schedules were hard to spot.
To-be ->
Add color-coded highlights, and a countdown feature to emphasize nearing unlock dates.
As-is
The holdings table, filled with countless wallet addresses, overwhelms CEX Managers.
To-be ->
CEX Managers want enhanced data visualization to provide clearer insights into holdings.
To-be ->
CEX Managers seek a clear view of token distribution across categories like CEX, DEX and investors.
Security Audits Page
As-is
CEX Managers are less interested in security audits.
To-be ->
Omit security audits due to CEX Managers’ lack of interest in non-real-time features.
Risk Factors Page
To-be ->
CEX Managers prefer risk details displayed in a fast, intuitive drawer UI, similar to cloud security services.
As-is
CEX Managers seek risks clearly categorized, such as Code Security and Centralization Risk.
To-be ->
Separate risk factors pages into Code Security and Code Privilege
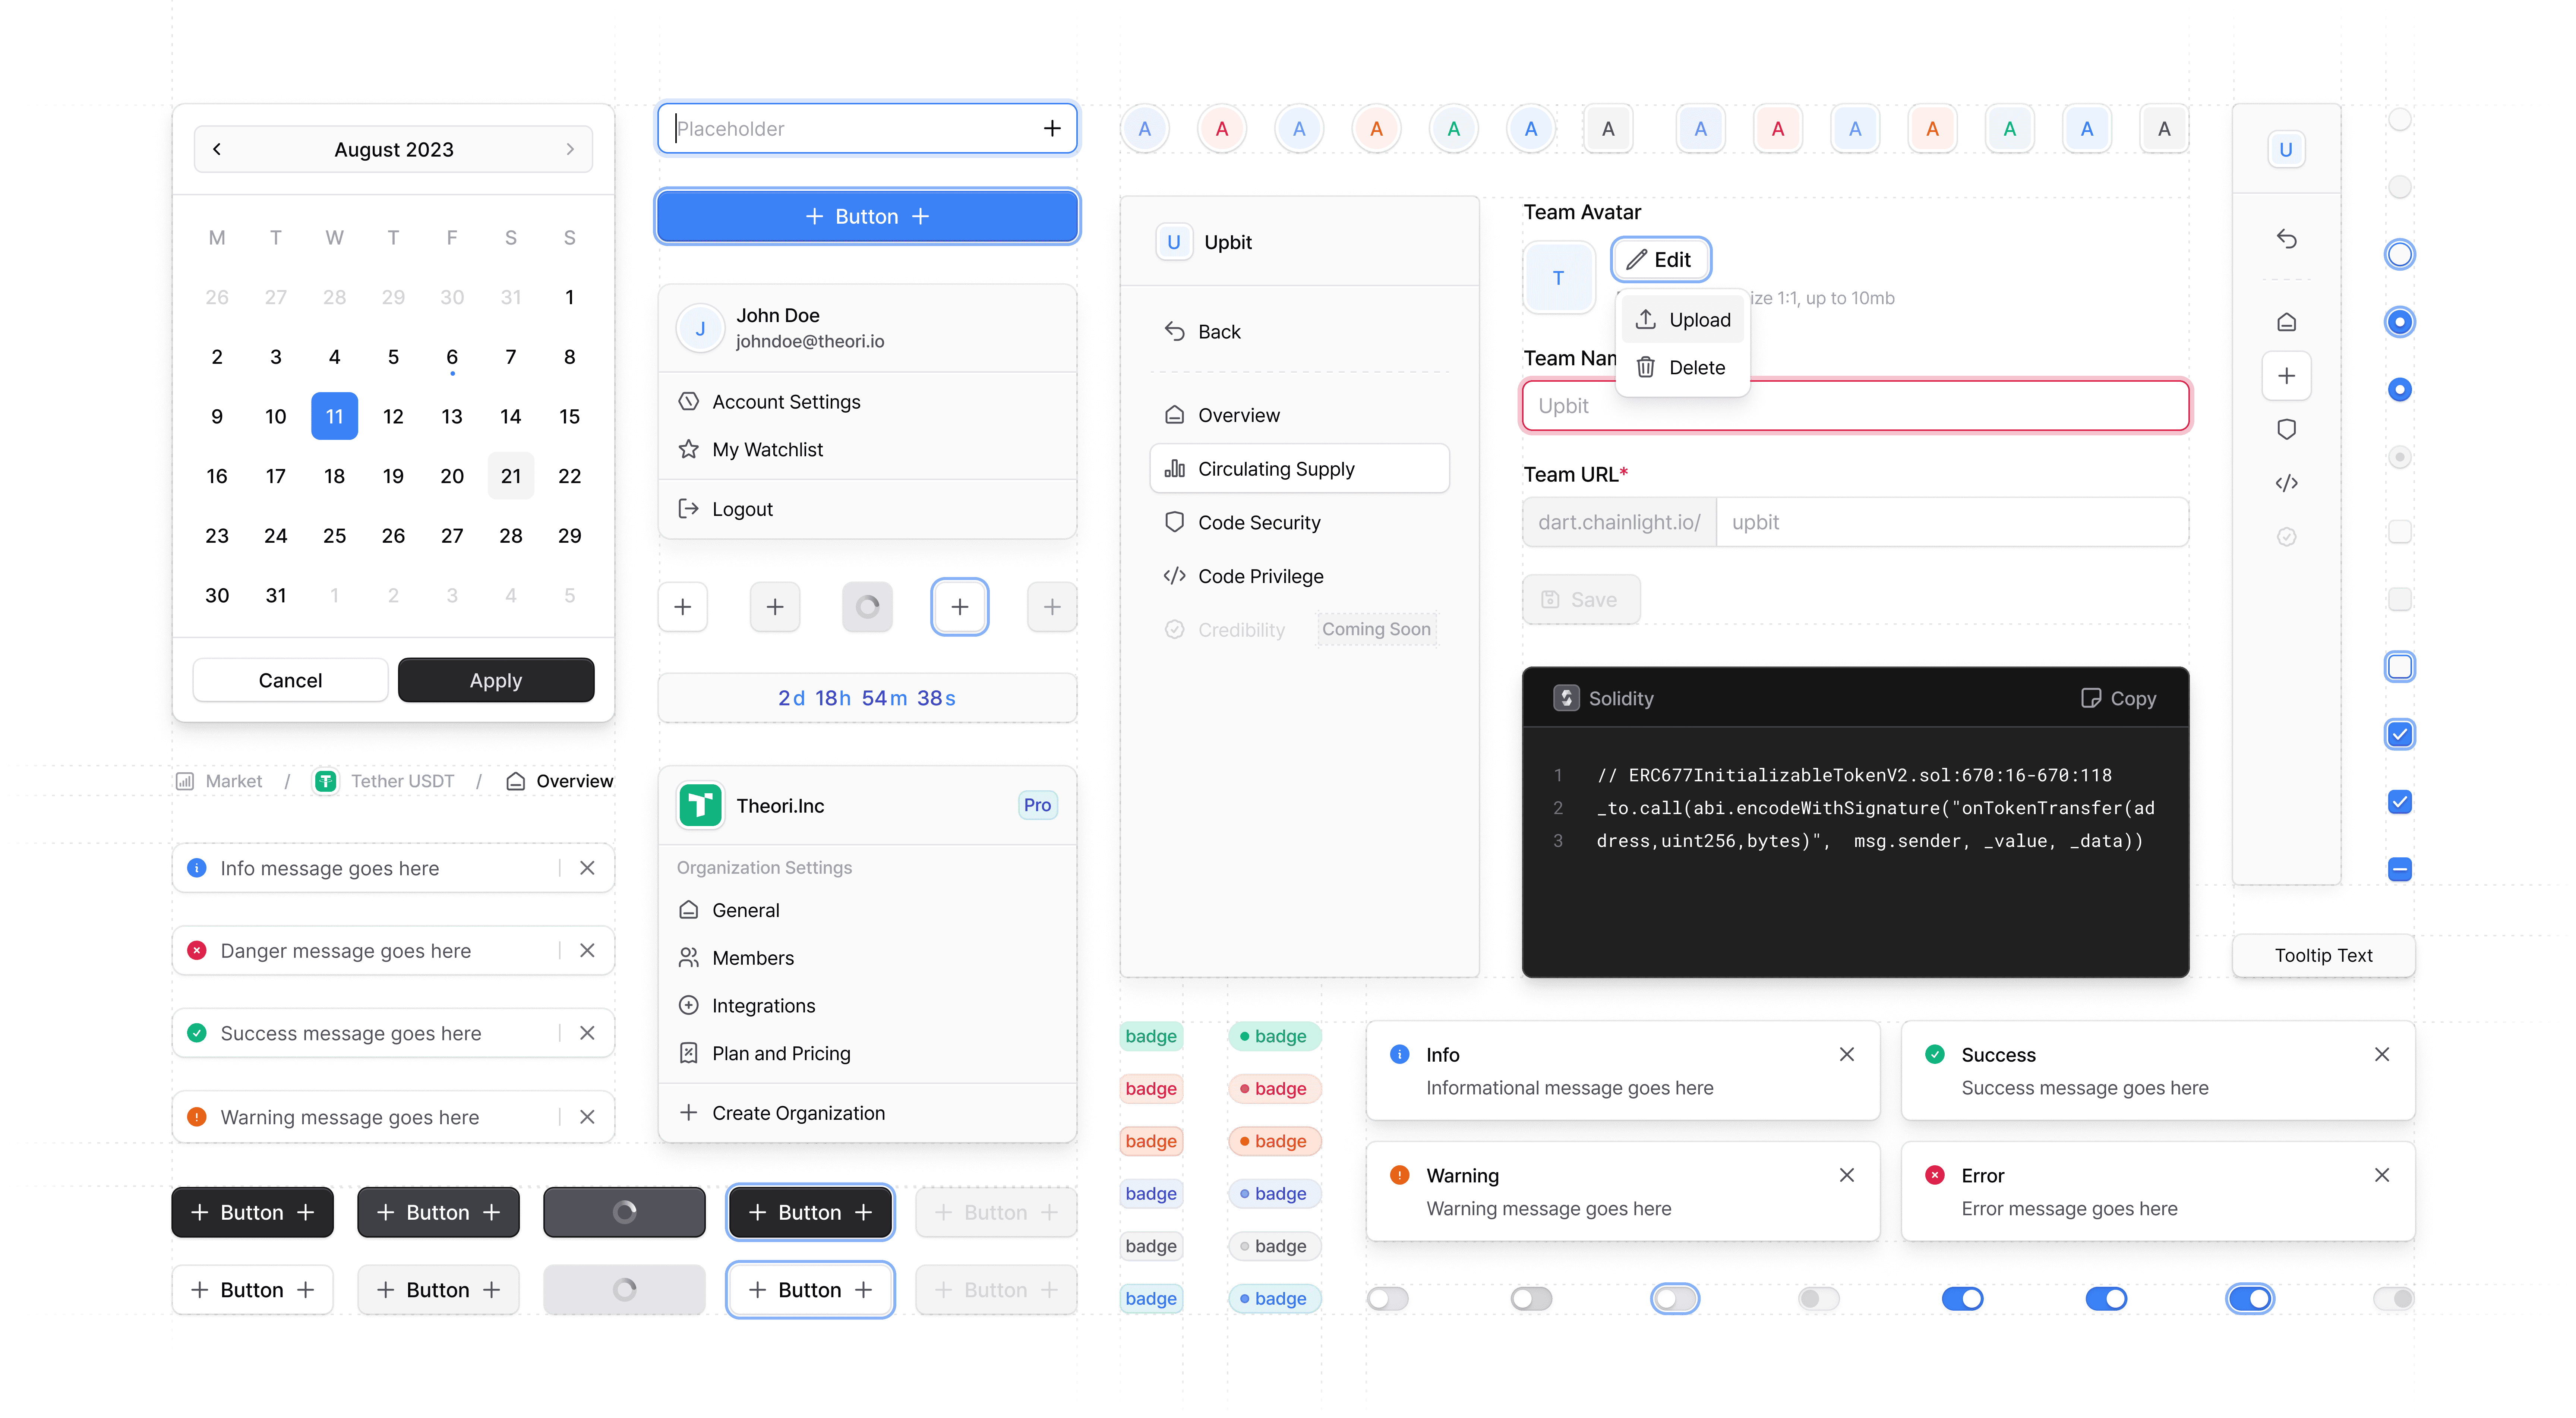
Building a Scalable Design System
I applied atomic design principles to DART’s UI, breaking it into foundational components. This involved creating design tokens for colors, typography, spacing, and corner radius to ensure consistency and reusability. These tokens were applied across everything from buttons and tags to complex charts and tables in the risk dashboards. The system helped speed up development, supported cross-team collaboration, and made it easier to scale the platform as new features were added.
The Circulating Supply Challenge
CEX managers needed more than just token data. They needed a reliable source that showed where tokens were, how they moved, and what risks might be emerging, without piecing it together manually.
Previously, managers had to manually gather data from various sources and switch between spreadsheets, dashboards, and analytics tools. This fragmented process slowed them down, increased the chance of mistakes, and made it difficult to act on insights quickly.
Our goal was to centralize this into one interface that provided clear visuals, automated checks, and up-to-date information. I worked on translating complex blockchain data into tools that managers could use daily, without needing to be technical experts


1
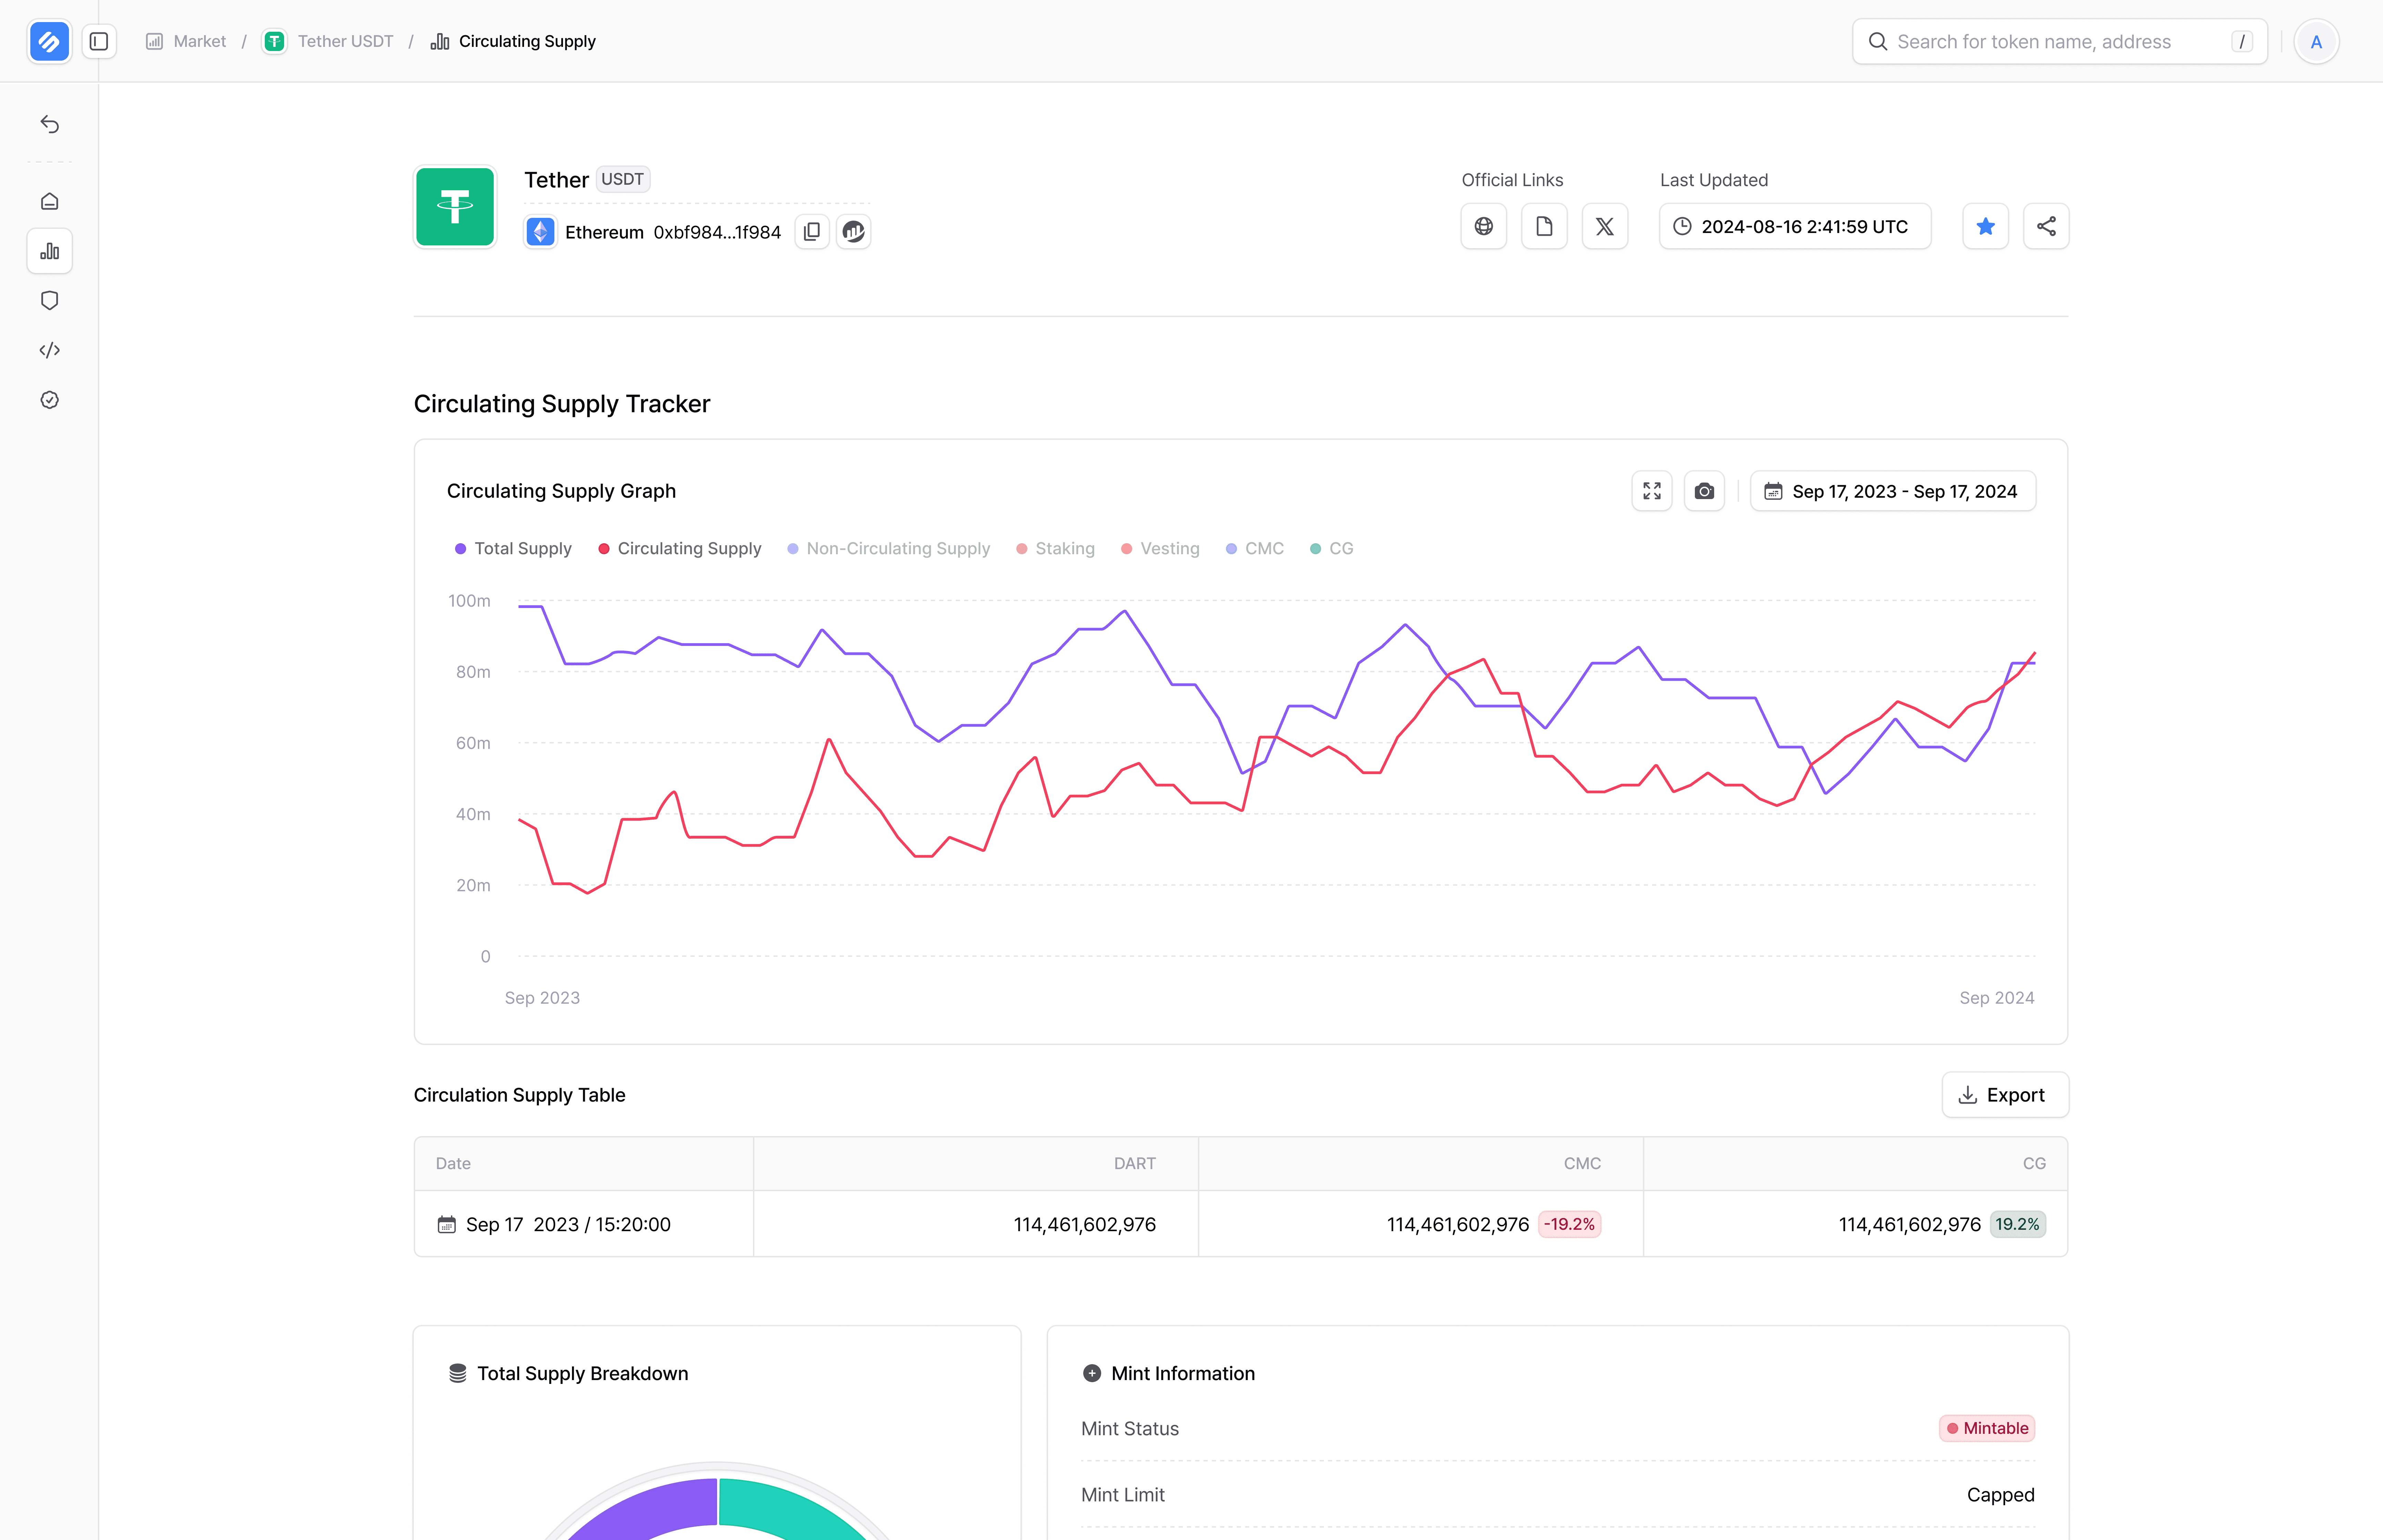
The Circulating Supply Tracker
I designed the tracker to display real-time supply data from DART, CoinGecko, and CoinMarketCap in a single, visual format. Managers could now instantly compare values and catch discrepancies between reported and actual supply.
For example, if CoinGecko showed 90 million tokens in circulation but DART tracked 85 million, the tool flagged it clearly, allowing users to investigate staking, vesting, or contract issues without switching tabs.
The result was fewer manual checks and much faster decisions.
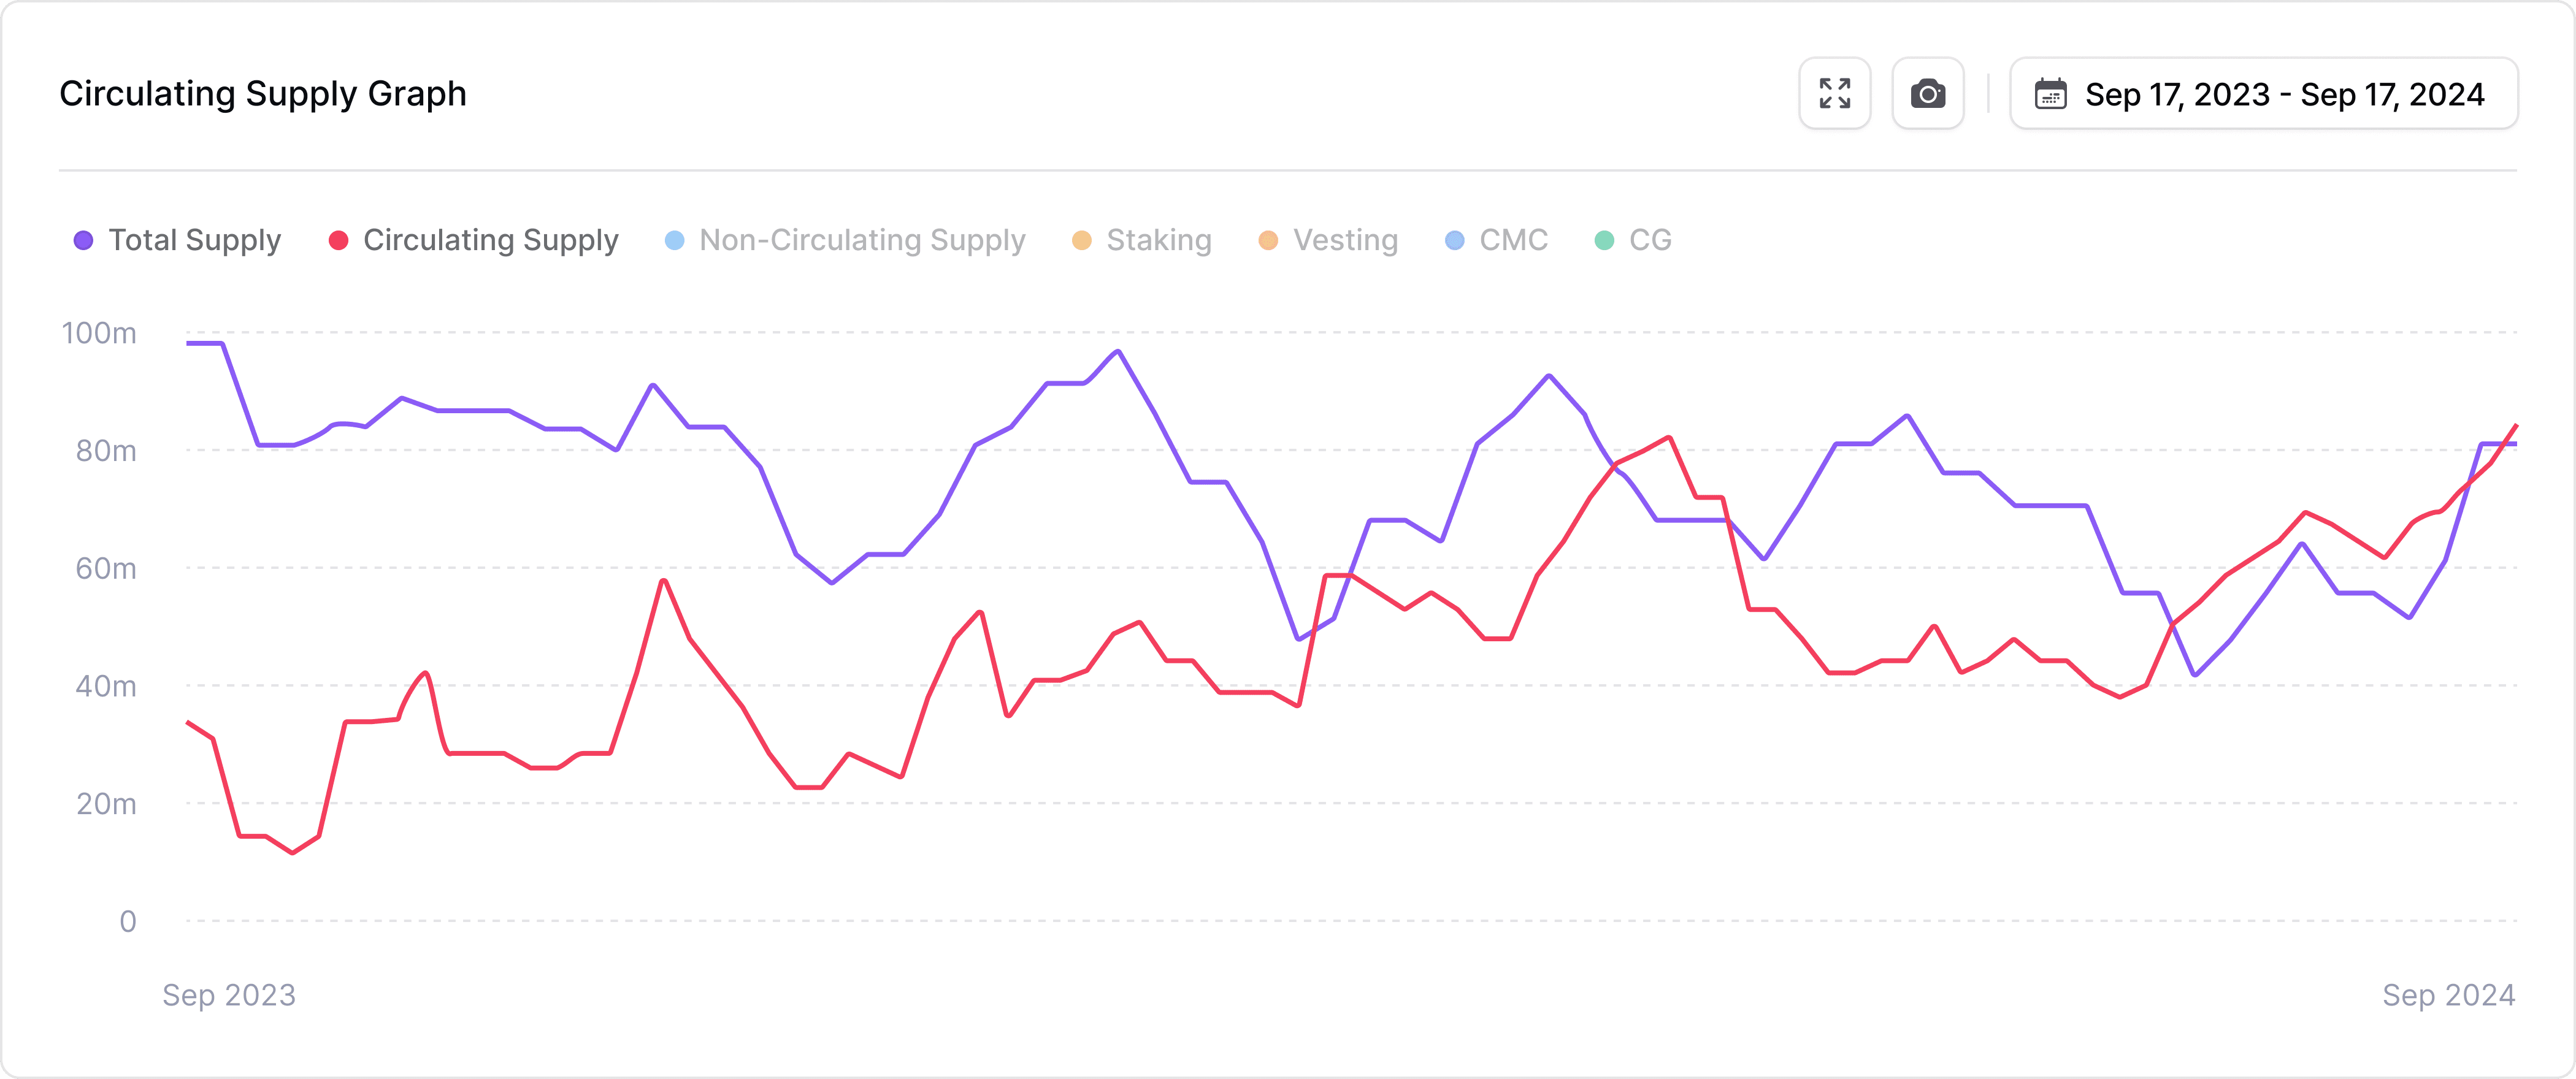
Circulating Supply Tracker Chart
2
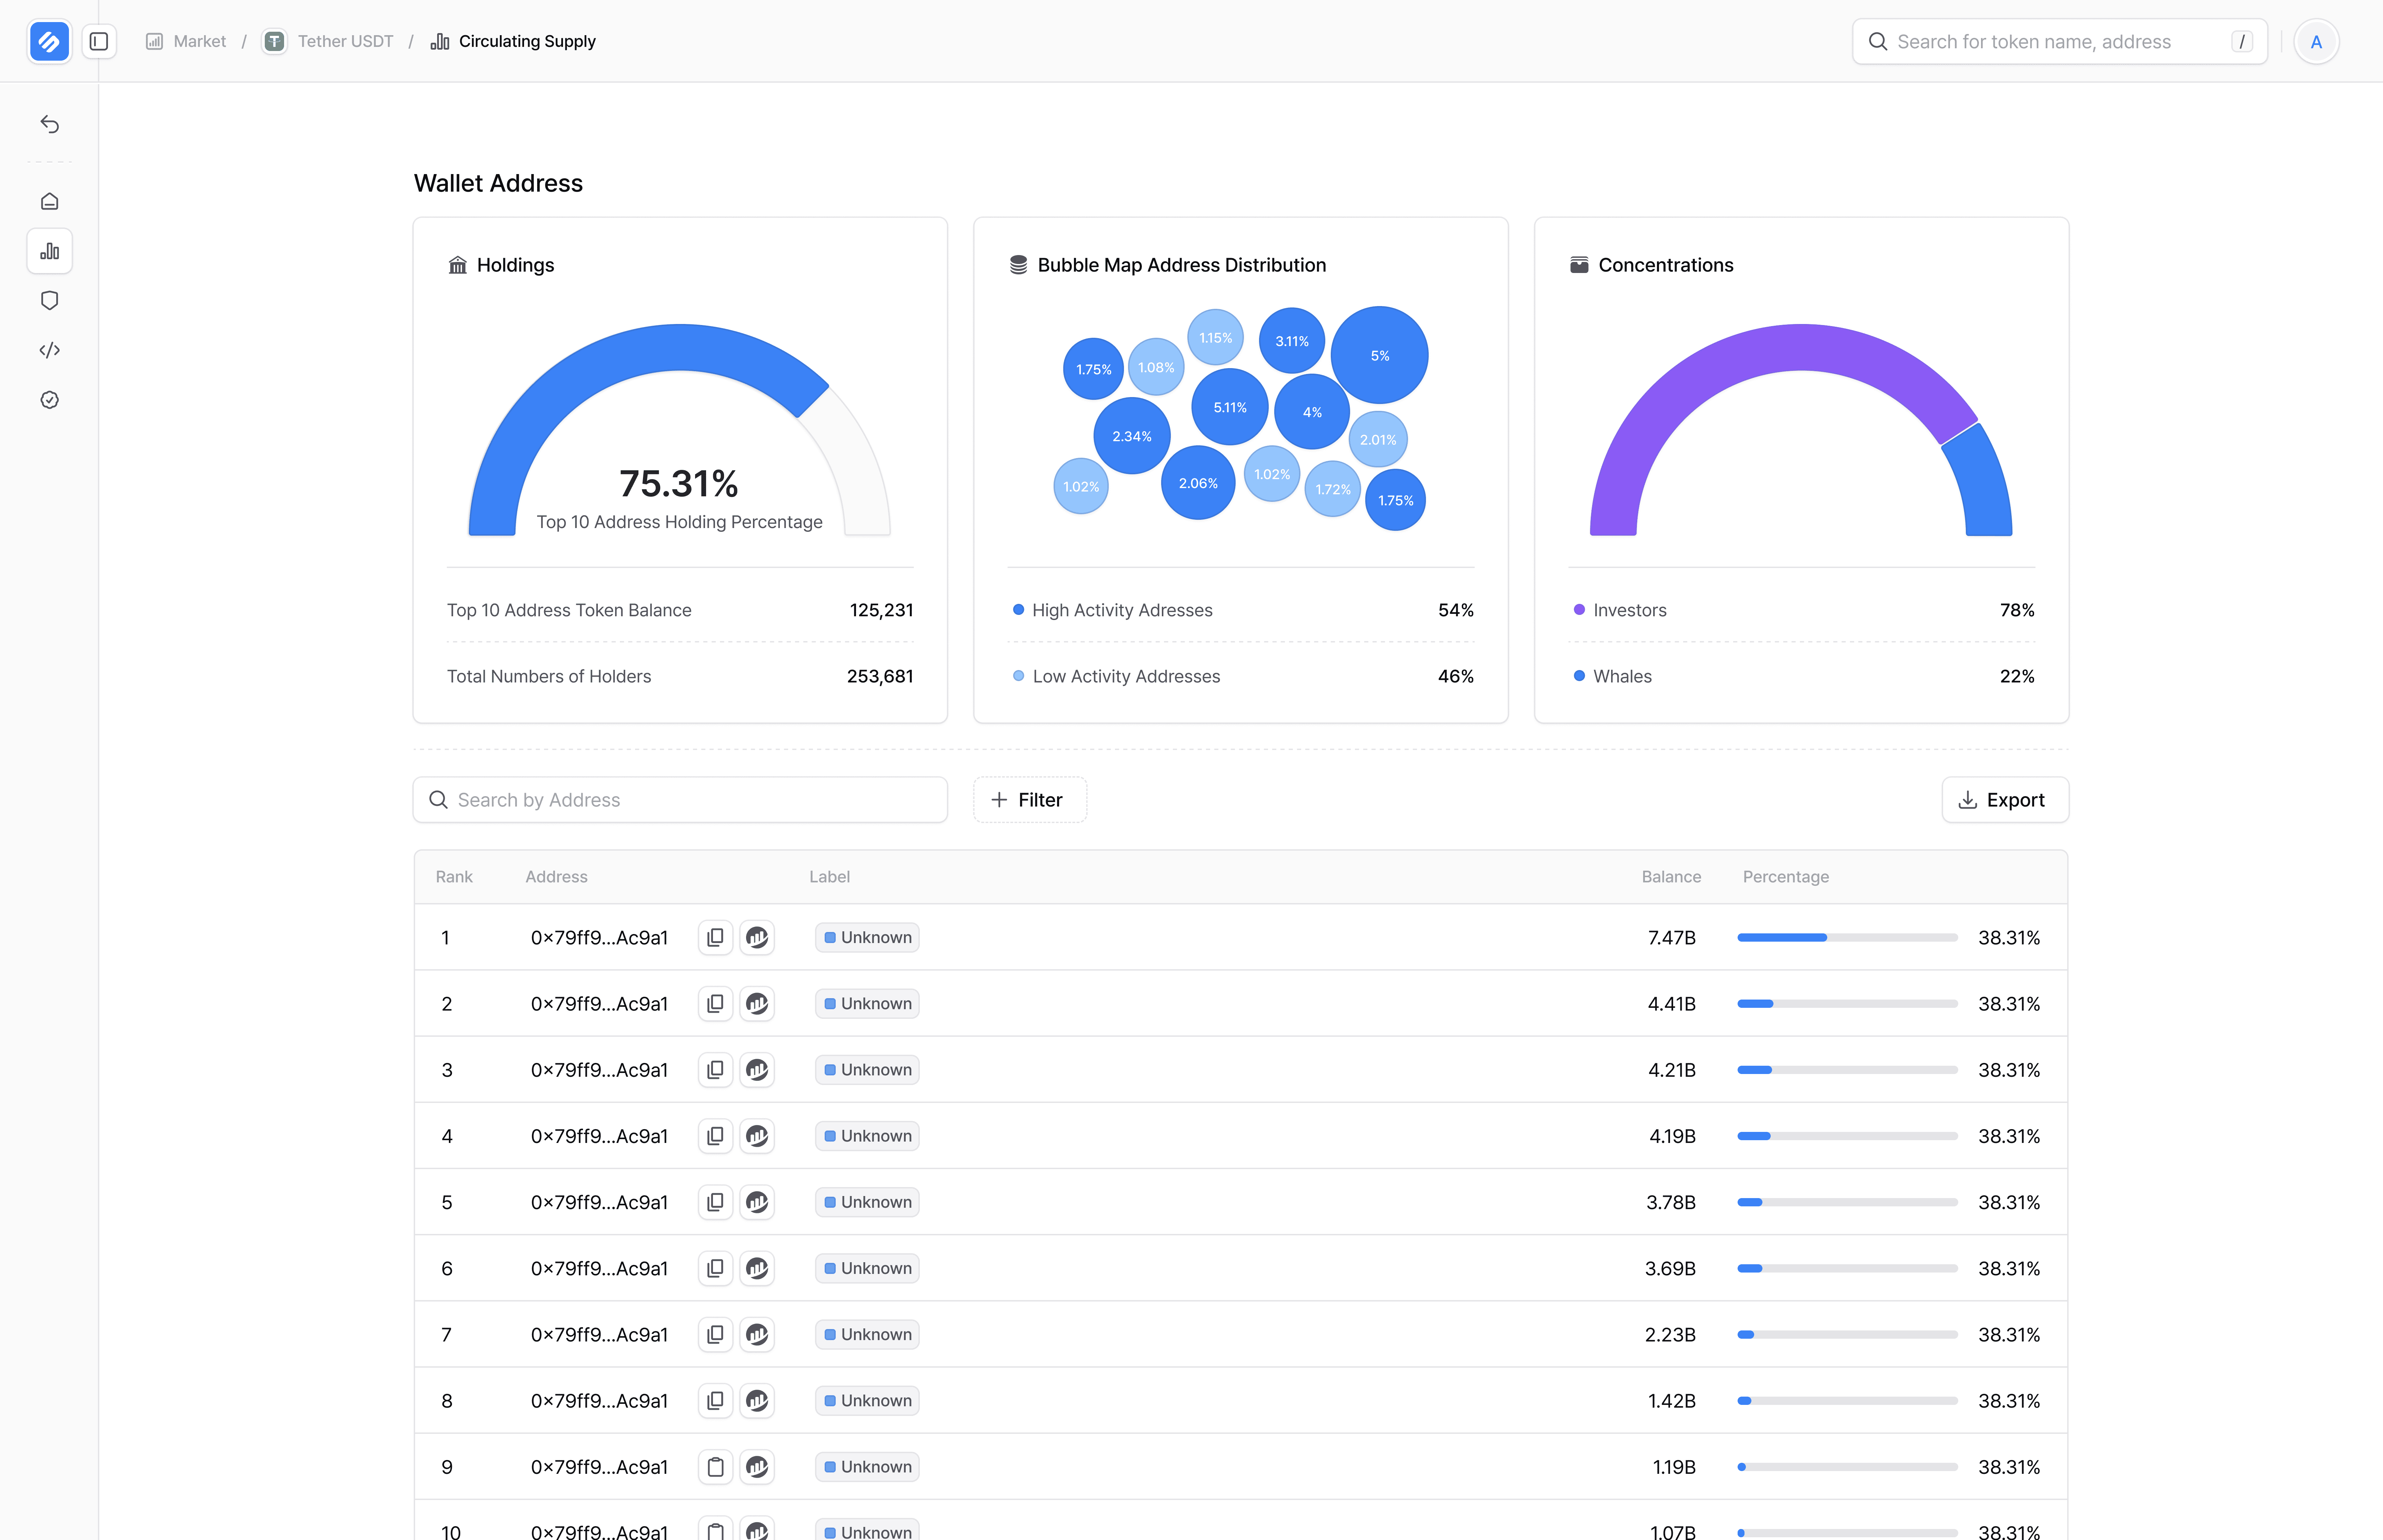
Wallet Address Visualization
To make token distribution easier to understand, I designed visual tools that translate complex blockchain data into actionable insights. The Holdings pie chart and wallet table allow users to see top holders, assess risk concentration, and track ownership changes without reading through raw on-chain data.
I also created a Bubble Map to highlight wallet behavior patterns. It surfaces activity clusters that may indicate manipulation or coordinated movement, helping managers act faster and with more context.
The Token Concentration view shows the balance between different types of holders, from retail investors to large stakeholders. This helps managers evaluate volatility risk and distribution fairness directly from the platform.

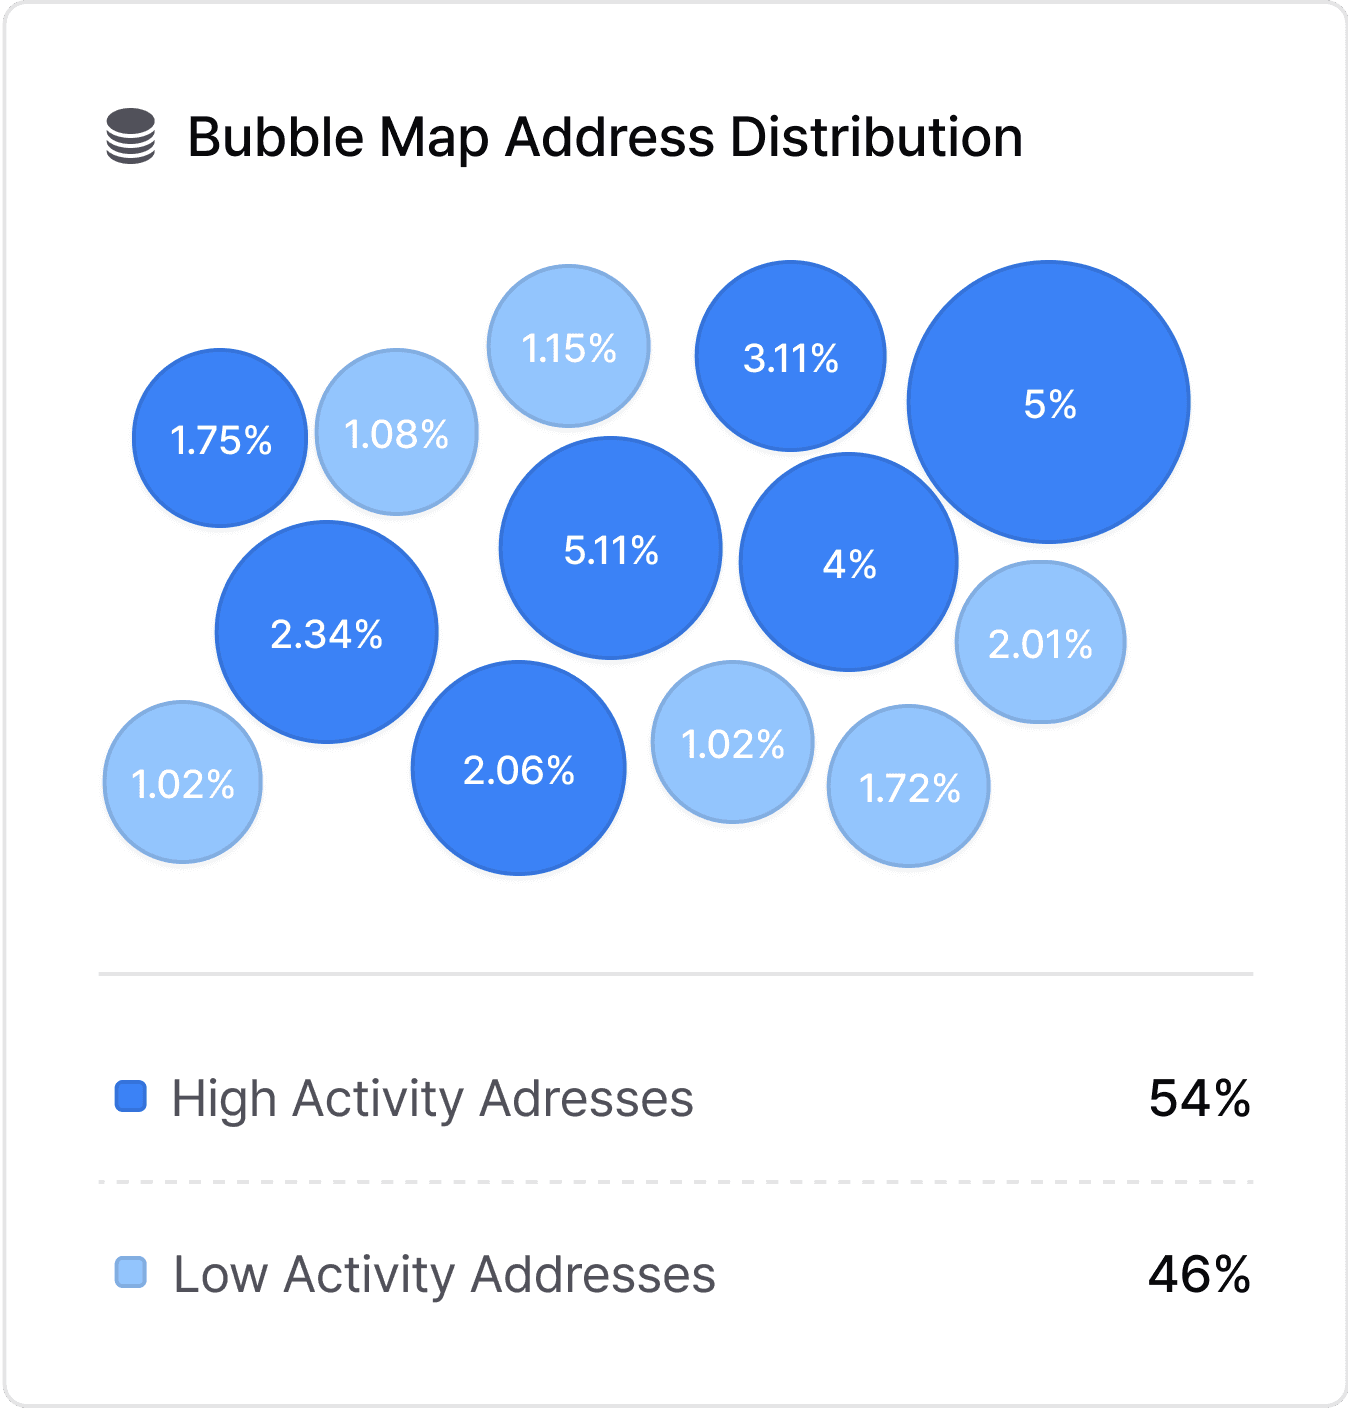

Holding Details Charts
3
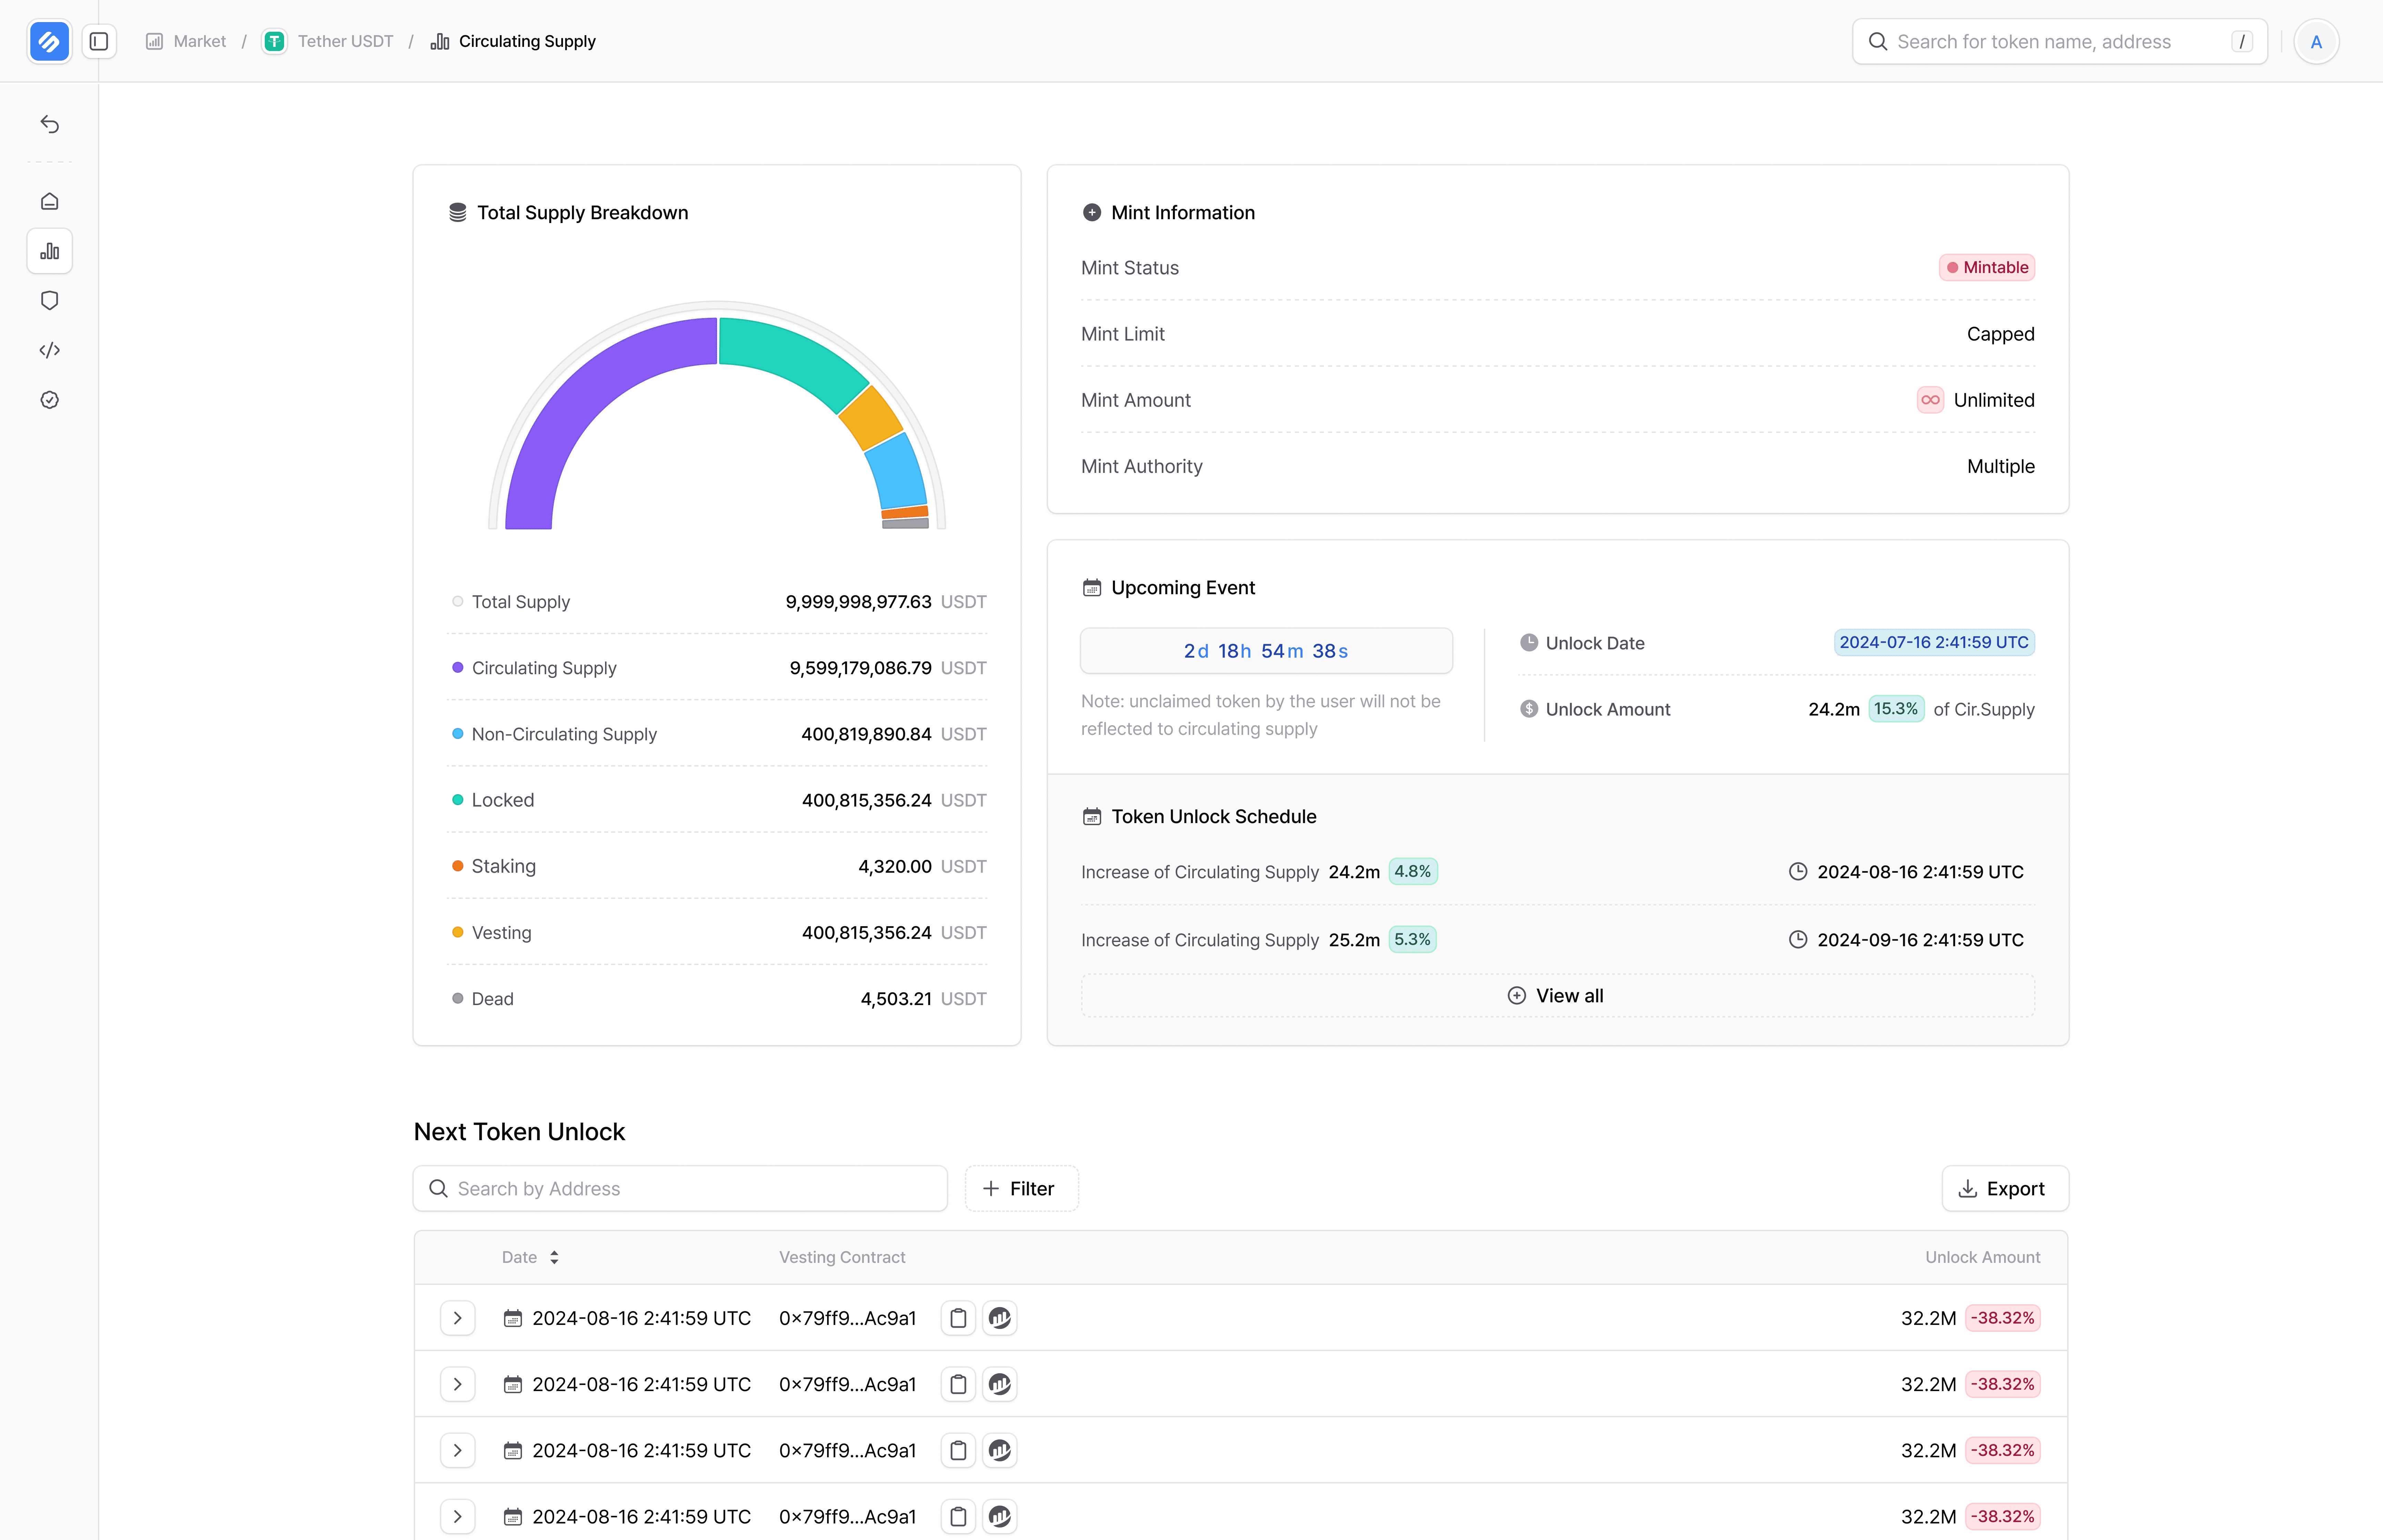
Token Unlocks
I replaced traditional unlock data tables with an interactive timeline. The new Unlock Schedule UI shows upcoming token releases with countdowns and supply impact indicators. Managers can now anticipate market shifts before they happen, instead of reacting after the fact.

Token Unlocks Card
4
Allocation
To improve transparency across exchanges, I designed tools like the Exchange Allocation viewer and Token Distribution Pie Chart. These visualizations show where tokens are held and how they are distributed across different platforms in real time.
This helps managers monitor liquidity, spot potentially risky concentrations, and take proactive steps when they see signs of imbalance or limited token availability in the market.

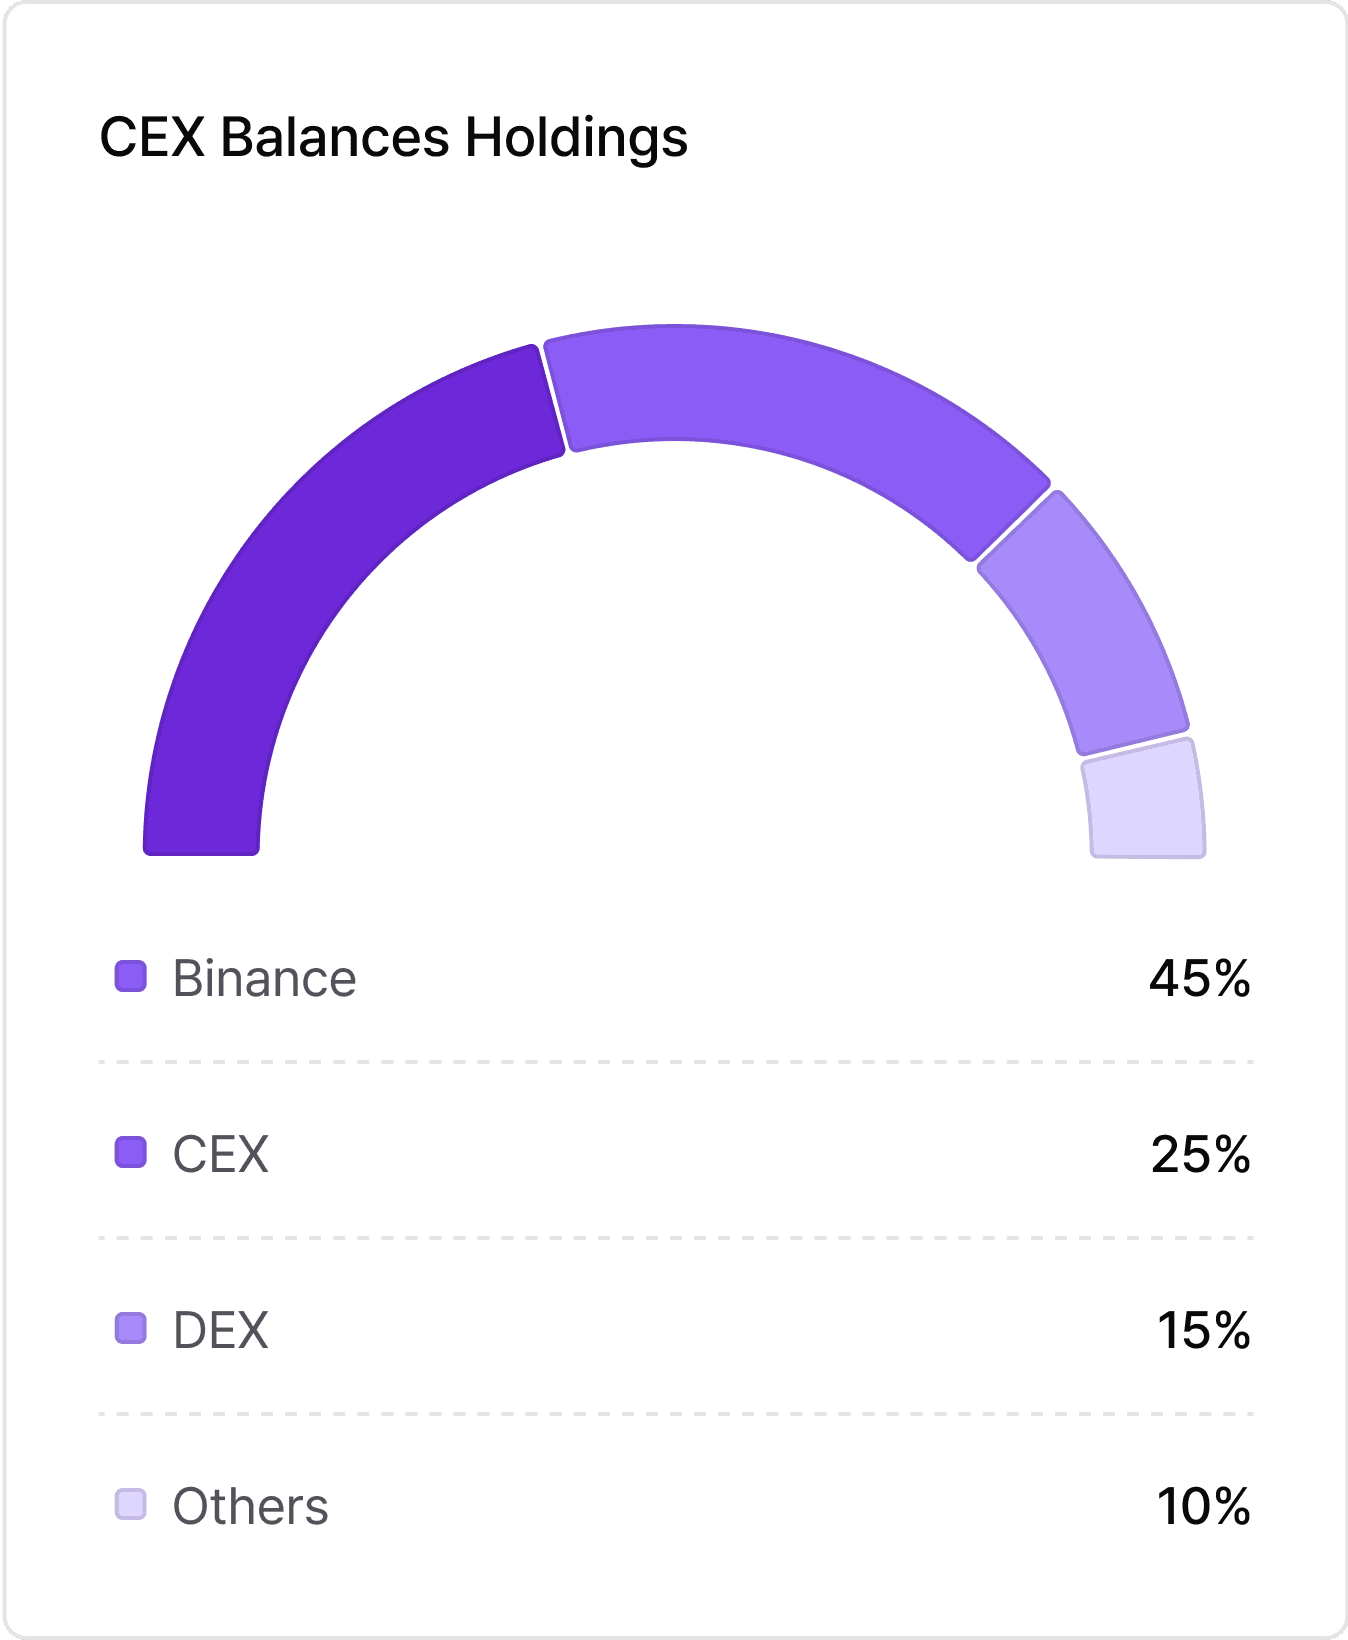
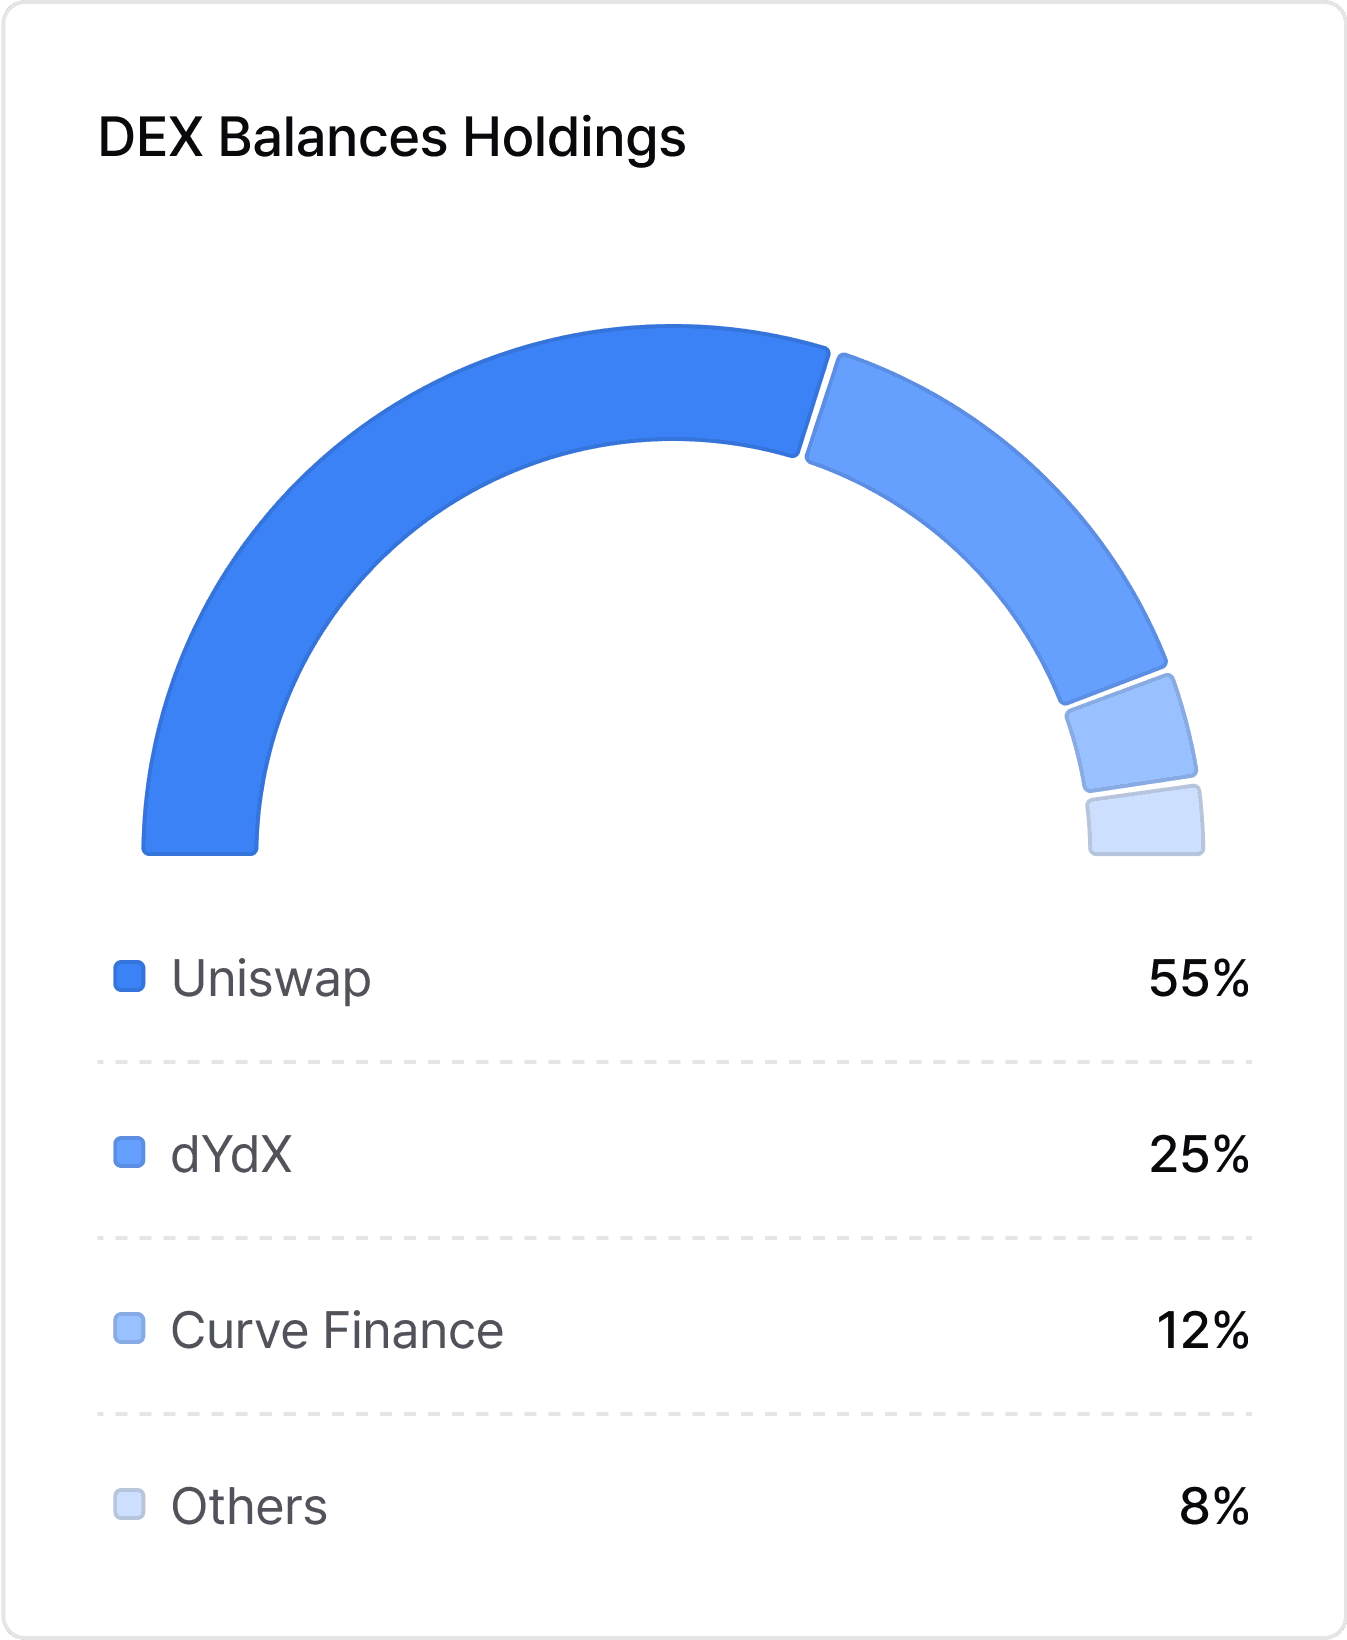
Allocation Charts
Security Intelligence Hub
Security monitoring needed to feel less like reading machine output and more like getting real answers. So I designed interfaces that turn complex code analysis into clear, actionable insights.
The Code Security page runs real-time scans on source code, flags issues immediately, and shows the severity using intuitive visuals so teams can respond quickly. The Code Privilege dashboard maps authority flows within smart contracts, highlighting centralization risks and alerting teams to suspicious changes. Together, these tools provide a live and evolving picture of a project’s security status before problems become critical.


1
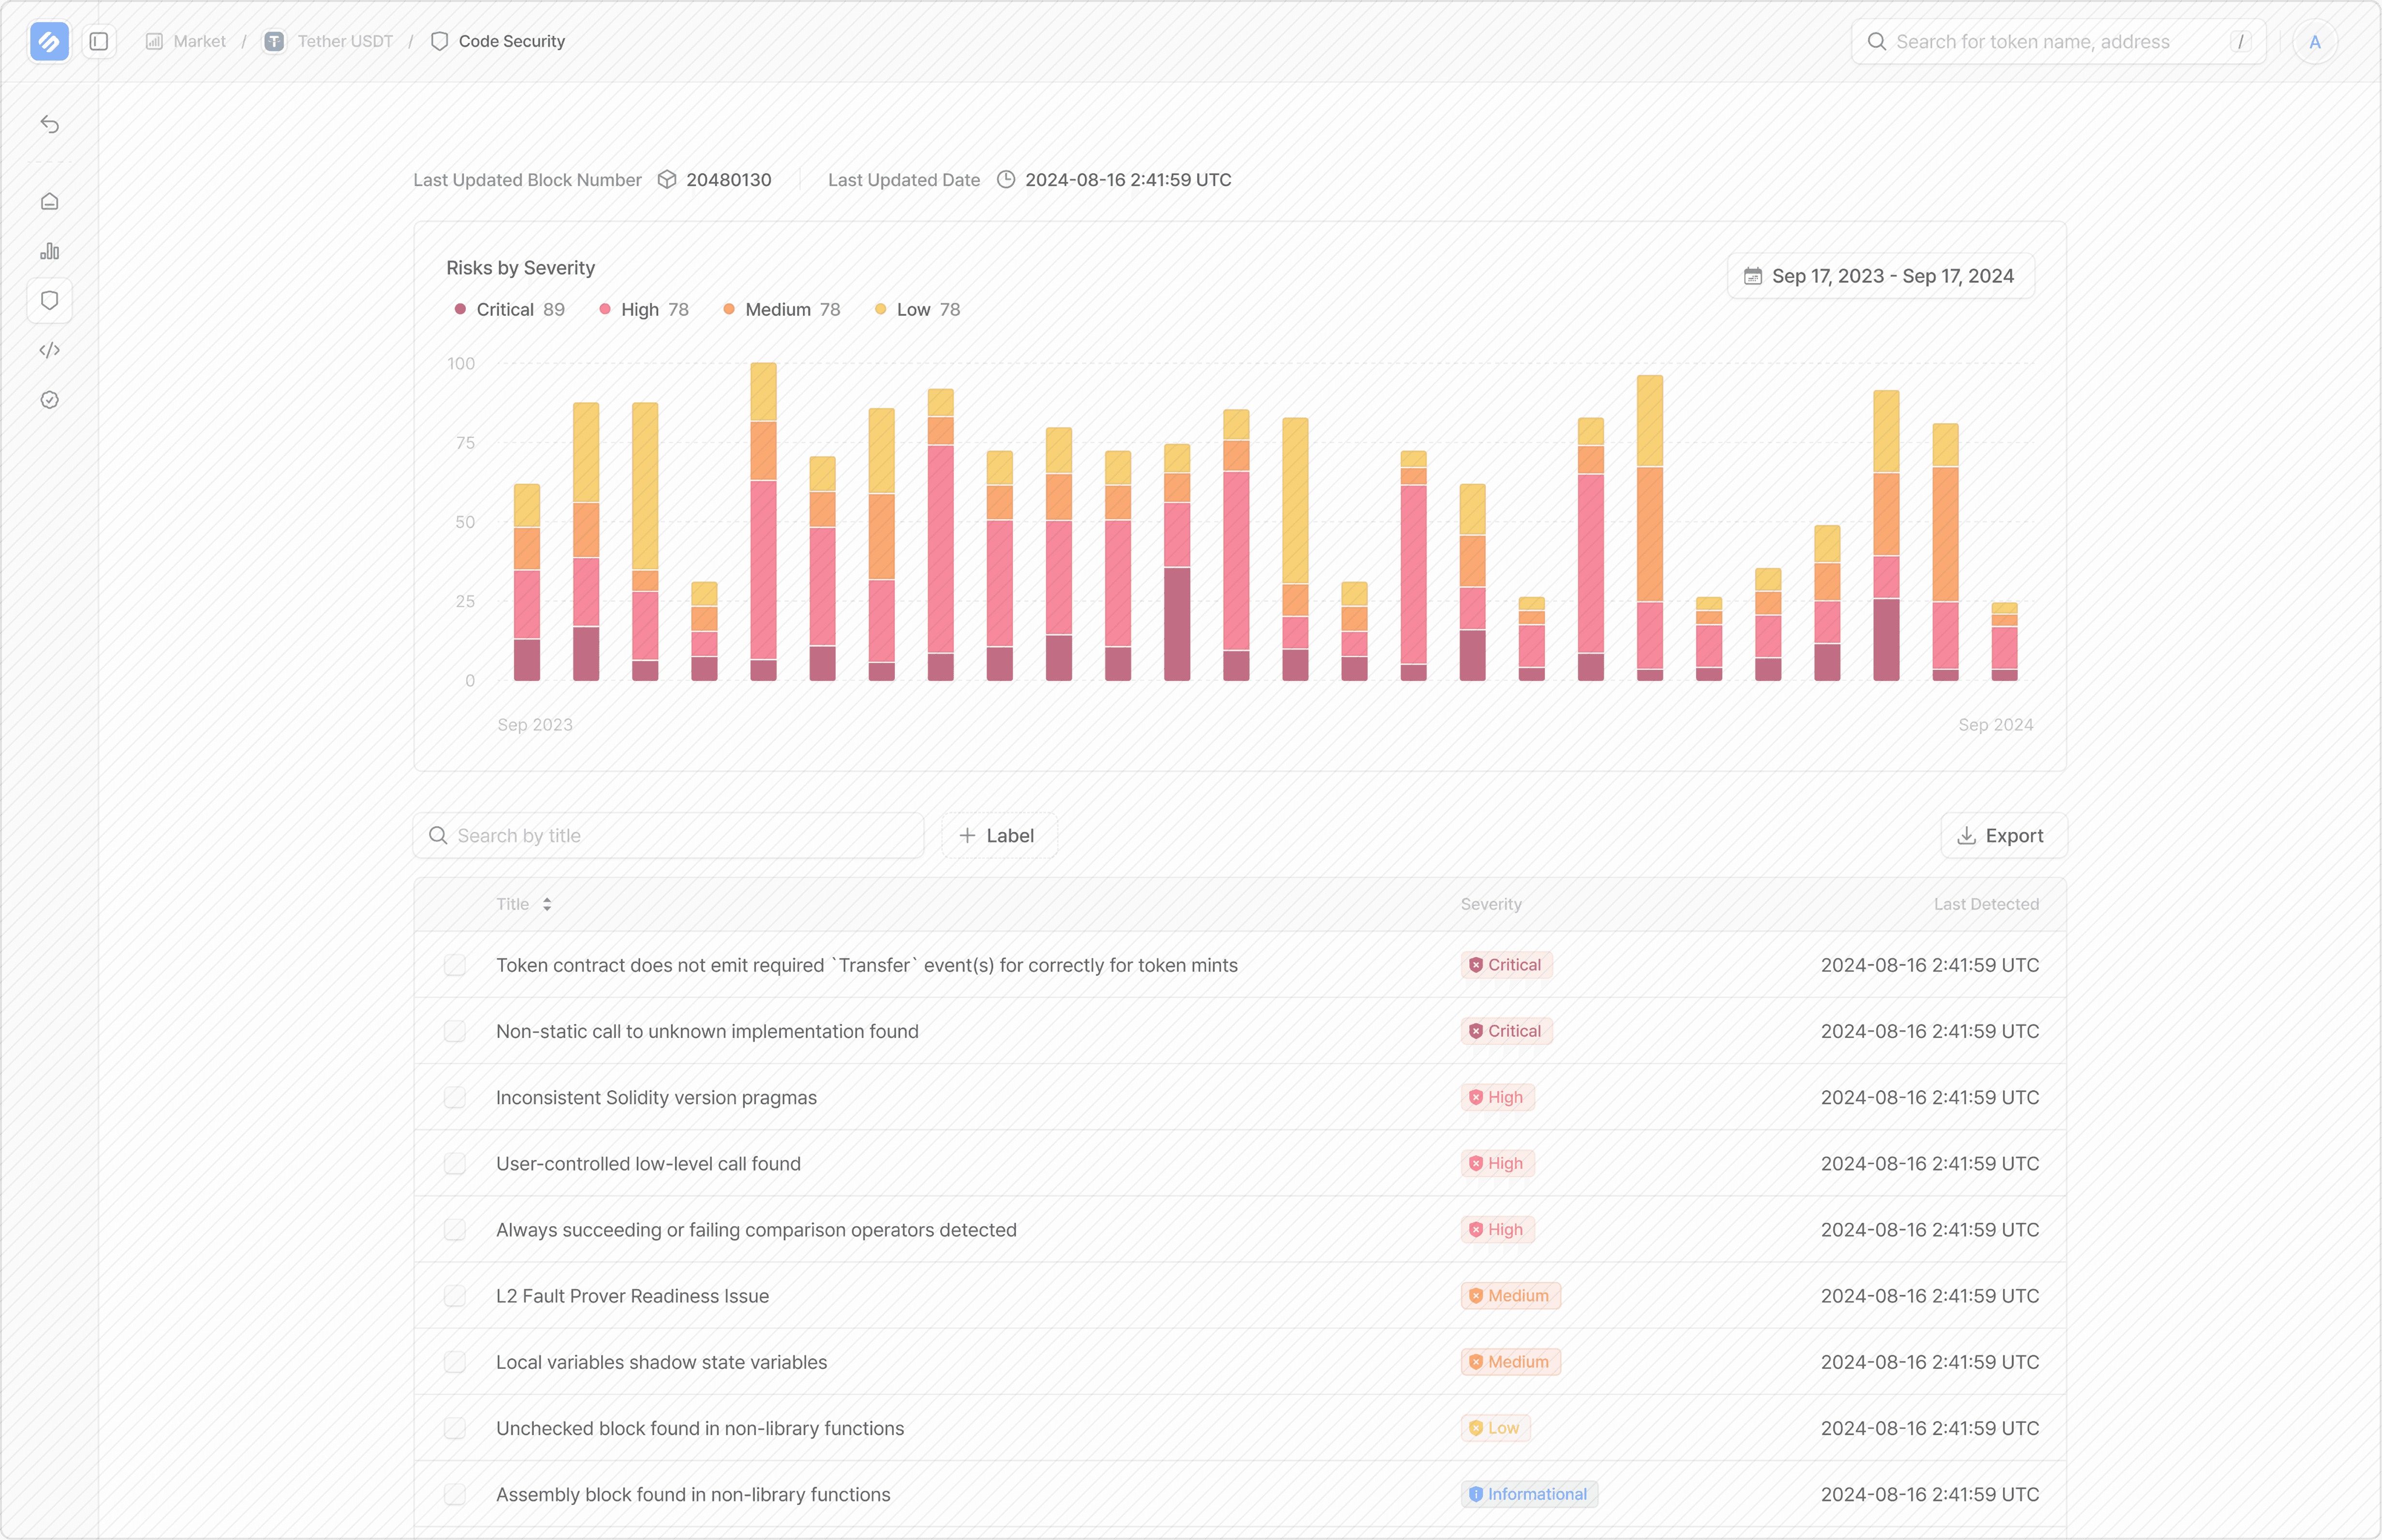
Risk by Severity Trend
The original chart worked but was hard to interpret. Unless you had a strong security background, understanding the data felt confusing.
I redesigned the chart to highlight the most important points. It now shows which vulnerabilities are most severe and how they change over time. I used simple categories, clear visual hierarchy, and added real-time updates alongside historical tracking. This helps teams immediately see risk trends and act faster.
Risk by Severity Stacked Bar Chart
2
Severity Badges
To make threat levels easy to read, I introduced Severity Badges. These are clear color-coded labels that identify the level of threat as Critical, High, Medium, Low, or Informational. They help users quickly prioritize tasks without reading through long reports.

Severity Badges
3
Risk Details
For more detailed analysis, I created the Risk Details view. It shows a summary of the issue, a technical breakdown, source code reference, and potential impact. I also included clear recommendations so users can fix problems without switching between different tools.
We changed the details page to a details drawer. The previous design was inefficient, as the CEX manager had to switch back and forth between pages. The new UI displays the details in a drawer that is easily accessible and closable.

Risk Details Drawer
Impact
By designing these tools from the ground up, I turned early feedback and rough wireframes into a fully working product shaped specifically for CEX managers. Every feature, from real-time risk tracking to token supply analysis, was created to support clear decision-making, fast responses, and confident action.
Risk management became faster and easier to use through visual tools that surface critical threats and show how they evolve over time.
Token supply validation moved from scattered processes to one reliable system that provides accurate insights in real time.
Managers no longer depend on manual work or switching between tools. All essential insights are available in one place and always ready to act on.
Conclusion
Designing DART was one of the most challenging and rewarding projects I’ve worked on. It pushed me to quickly absorb a complex domain, balance shifting priorities, and create meaningful solutions for real-world problems in the Web3 space.
My key takeaway from this project is the importance of staying close to users and iterating quickly. By actively listening to exchange managers and aligning the product roadmap with their real needs, we moved the product in a more valuable direction.
This project strengthened my product thinking and user-centered design skills. It also helped me grow as a communicator and team player in a fast-paced, early-stage environment.
This design is still evolving.
Final version coming soon.
This responsive design is still evolving.
Final version coming soon.
This responsive design is still evolving.
Final version coming soon.
For the best viewing experience, please open this portfolio on a desktop device.
For the best viewing experience, please open this
portfolio on a desktop device.
For the best viewing experience, please open this
portfolio on a desktop device.